
Map Impact CEO joins GARP Podcast to discuss The Climate Risks We Can No Longer Ignore

When climate risk is discussed, attention usually turns to flooding, storms and coastal erosion. These risks are well studied, widely modelled and increasingly built into financial decision‑making.

But dry perils such as heat stress, drought and wildfire susceptibility are still flying under the radar even though their impact is increasingly prominent.

In a recent episode of the GARP Climate Risk Podcast, Map Impact founder and CEO Richard Flemmings joined host Joe Paisley to discuss why these risks have been underestimated, and why understanding the landscape itself is critical to managing them.

About GARP and the Climate Risk Podcast

The podcast is produced by the Global Association of Risk Professionals (GARP), an international organisation representing risk practitioners across banking, insurance, asset management and the wider financial sector. Through research, education and professional certification, GARP plays a key role in helping financial institutions understand and respond to emerging risks, including climate and sustainability‑related challenges.

Why Heat and Wildfire Risk Have Been Overlooked

In the UK, perception has played a major role in shaping climate conversations. Heatwaves are often reported with photos of beaches and ice creams, while flooding dominates headlines through visible, immediate damage. Yet the reality is changing quickly.

The UK now has a recognised wildfire season. Recent years have seen dramatic increases in fires, driven by drier springs and vegetation growth following wetter winters. Crucially, many of these fires occur at the edge of towns and cities, placing pressure on emergency services and creating indirect risks that rarely show up in traditional models.

These dry perils aren’t theoretical. They’re already affecting communities, infrastructure and housing providers and they’re only set to grow.

Starting With the Landscape, Not the Model

Map Impact takes a deliberately bottom‑up approach to climate risk. Instead of starting with broad atmospheric projections alone, analysis begins with the physical landscape: land cover, vegetation, and biodiversity.

The Map Impact approach grew out of early work supporting Biodiversity Net Gain reporting in England, where our nationwide habitat and biodiversity map BiodiversityView was created. That detailed understanding of land use now underpins climate hazard assessment.

By focusing on hazard data, rather than trying to model full financial impacts, Map Impact provides transparent inputs that financial institutions and asset owners can integrate directly into their own risk frameworks.

What This Means for Housing

Housing associations were among the first organisations to see the value of this approach. Managing millions of homes, many built decades ago, they’re already facing the challenge of overheating during heatwaves, especially in dense urban areas.

In one early case, a housing provider was told by a standard model that heat stress wasn’t a concern. Tenant experience told a very different story. Using land‑led, high‑resolution analysis, Map Impact identified real heat stress exposure across the portfolio, enabling the association to prioritise retrofit programmes and focus investment where it would have the greatest impact.

This kind of insight allows providers to balance competing demands: keeping homes warm in winter while reducing overheating risk in increasingly hot summers.

Nature‑Based Solutions and Joined‑Up Thinking

A recurring theme in the podcast conversation was the role of nature‑based solutions. Greening urban spaces, reducing hard surfaces, and restoring landscapes can significantly reduce heat accumulation and wildfire susceptibility. But the real impact comes when these actions are coordinated at scale.

Through work on Local Nature Recovery Strategies, Map Impact has seen how housing providers, local authorities and financiers can align objectives, even within the UK’s fragmented land ownership system.

There are challenges, but the opportunity to link climate resilience, biodiversity recovery and finance is growing.

Looking Ahead

Dry perils have been underestimated for too long. As regulation tightens and climate impacts intensify, understanding heat, wildfire and drought risk at a local, landscape‑level will be essential.

As Richard noted in the podcast, the key for organisations is clarity: knowing what climate data shows, what it doesn’t, and how to use it responsibly.

By starting with the land itself, it becomes possible not just to assess risk but to plan meaningful adaptation and build resilience where it matters most.


You can listen to the podcast “The Case for Adaptation: Heat Stress and the Built Environment” below, or here.


A Data Journey for Physical Climate Risk under SS5/25

Executive Summary

The purpose of this ‘Data Journey’ is to support regulated firms in understanding, evidencing, and governing the use of physical climate hazard data within the expectations set out in PRA SS5/25. It is intended to provide a clear explanatory bridge between data design choices, regulatory workflows (including asset identification, materiality assessment, and scenario analysis), and the practical use of hazard insight to inform proportionate management action.

This document does not prescribe modelling approaches, replace firm-owned judgement, or introduce new risk methodologies. Rather, it is designed to improve explainability, transparency, and consistency in how hazard-led data is interpreted and used alongside existing risk management frameworks.

The ‘Data Journey’ is a supplementary narrative that connects (i) the technical construction of hazard data, (ii) the practical steps firms must undertake under PRA SS5/25, and (iii) how hazard insight can be translated into proportionate management action and increased portfolio resilience.

It is not designed to be read linearly by all readers. Instead, it functions as a reference ‘journey map’ that different stakeholders can dip into depending on their role.

Why Map Impact Aligns with the ICMA Code of Conduct for ESG Data Providers

Introduction

Map Impact has adopted the principles set out in the International Capital Market Association (ICMA) Code of Conduct for ESG Ratings and Data Products Providers.

This is part of our commitment to ensuring that our climate and biodiversity datasets are not only scientifically robust, but also transparent, well-governed and suitable for use within regulated financial decision-making.

What is the ICMA Code of Conduct?

The ICMA Code is an industry-led framework designed to improve trust, transparency and governance in the provision of ESG data.

It was developed in response to increasing reliance on ESG data by:

  • banks and building societies
  • insurers and reinsurers
  • asset managers and investors
  • regulators and supervisory bodies

The Code focuses on four core principles:

  • Governance: Clear oversight and accountability for how data is produced
  • Transparency: Visibility of methodologies, data sources and assumptions
  • Systems & Controls: Robust processes to ensure data quality and consistency
  • Conflicts of Interest: Safeguards to protect the integrity and independence of outputs

It operates on a voluntary ‘comply or explain’ basis, with providers expected to publicly disclose how they align with these principles.

Why This Matters for Climate and Nature Risk Data

Climate and biodiversity risk data is increasingly required and used within:

  • credit risk models
  • insurance underwriting
  • capital and stress testing frameworks
  • regulatory reporting

However, the quality and transparency of ESG data can vary significantly across providers.

For regulated firms, this creates a challenge:

Can the data be relied upon within risk management, audit and regulatory frameworks?

The ICMA Code provides a benchmark to help answer that question.

What It Means for Map Impact

Aligning with the ICMA Code formalises and strengthens how we develop and deliver our datasets.

In practice, this means:

  • Documented methodologies describing how our hazard datasets are derived
  • Clear data lineage from environmental inputs through to property-level outputs
  • Controlled data processes including versioning, validation and release management
  • Defined governance structures overseeing methodology and dataset development

Our datasets – BiodiversityView, HeatView, DroughtView and WildfireView – are designed as objective, hazard-based data layers, not subjective ESG ratings. This aligns naturally with the Code’s emphasis on transparency and independence.

Benefits for Users of Map Impact Data

For banks, insurers and other regulated users, alignment with the ICMA Code provides several practical advantages:

1. Greater transparency and explainability
Users can understand how data is constructed, enabling effective model validation and internal challenge.

2. Stronger governance and audit readiness
Documented processes and controls support use within model risk frameworks, audit reviews and regulatory engagement.

3. Confidence in data integrity
Structured systems and controls reduce the risk of inconsistency or undocumented changes.

4. Clear model boundaries
By focusing on hazard exposure rather than financial outcomes, Map Impact data can be integrated cleanly into internal models without hidden assumptions.

5. Reduced onboarding friction
Availability of supporting documentation (methodology packs, assurance summaries, alignment notes) supports procurement, validation and vendor governance processes.

A Subtle but Important Additional Benefit

Alignment with the ICMA Code also helps address a common issue in climate risk: The tendency to rely on incomplete or overly simplified data.

By improving transparency and governance, the Code encourages more robust and comprehensive risk assessment, particularly for emerging hazards such as heat, drought and wildfire.

Looking Ahead

Climate and nature-related risks are evolving rapidly, as are regulatory expectations.

We view alignment with the ICMA Code not as a one-off exercise, but as part of an ongoing commitment to:

  • continuous methodological improvement
  • engagement with industry and regulatory developments
  • supporting clients in meeting their own governance and risk management obligations

Conclusion

The ICMA Code is ultimately about trust.

For Map Impact, alignment reinforces our position as a provider of transparent, decision-useful environmental risk data.

For our users, it provides greater confidence that the data they rely on can stand up to scrutiny, whether from internal risk functions, auditors or regulators.

Find out more here: https://www.icmagroup.org/sustainable-finance/icma-and-other-sustainable-finance-initiatives/code-of-conduct-for-esg-ratings-and-data-products-providers-2

Supporting Climate Risk Materiality Assessment under PRA SS5/25: A Hazard-Led Approach

A hazard-only, portfolio-wide framework aligned to supervisory expectation

Map Impact Whitepaper, January 2026


Executive Summary

The Prudential Regulation Authority’s Supervisory Statement 5/25 (SS5/25) marks a clear shift in regulatory expectations for the management of climate-related financial risks. Regulated firms are now required to demonstrate evidence-based, portfolio-level assessments of physical climate risk materiality, supported by transparent data, documented assumptions and appropriate governance. Within six months of SS5/25’s publication, firms must complete a gap analysis and prepare a Board-approved implementation plan, signalling an immediate supervisory focus on capability rather than aspiration.

A central challenge for many firms is the lack of consistent, property-level physical climate hazard data capable of supporting defensible materiality assessments across portfolios. Legacy approaches, often limited to flood and coastal erosion, provide an incomplete view of physical climate risk and are insufficient to meet SS5/25’s expectations, where other hazards such as heat stress, drought and wildfire may be relevant.

This technical white paper sets out a hazard-led approach to supporting SS5/25 implementation. It explains how Map Impact’s physical climate hazard datasets are constructed, how they align with supervisory expectations for data suitability and governance, and how they may be used by regulated firms as inputs to materiality assessment, scenario analysis and internal model development. The paper is explicitly scoped to hazard identification and interpretation. Map Impact provides hazard scores, hazard categories and scenario-aligned hazard deltas only; it does not estimate probability, vulnerability, exposure or financial loss.

By maintaining a clear separation between hazard inputs and firm-owned risk modelling, the approach described supports proportionality, model risk management and supervisory challenge. High-resolution, property-level hazard data enables firms to identify where physical climate risks may be material, justify qualitative or quantitative treatment, and embed climate considerations into existing credit, capital and governance frameworks without over-engineering or opacity.

This paper is intended for first-line risk and modelling teams, as well as second-line risk, model valuation, internal audit, and regulatory liaison functions involved in the review, governance and supervisory justification of climate-related data and methodologies.

SS5/25 Raises the Bar – Why Physical Climate Risk Data Just Became a Regulatory Priority for Banks and Insurers

On 3 December 2025, the UK Prudential Regulation Authority (PRA) published Supervisory Statement 5/25 ‘Enhancing banks’ and insurers’ approaches to managing climate-related risks’. SS5/25 replaces the original 2019 framework (SS3/19) and represents the most substantial tightening of climate-risk expectations for UK lenders and insurers to date.

The PRA has moved beyond high-level principles and introduced clear operational, data, granularity, and scenario-analysis expectations that all regulated firms must meet. A mandatory internal review, including gap analysis and a board-approved roadmap, must be completed by June 2026, and the guidance strongly emphasises the need for robust, forward-looking, and spatially granular physical climate-risk data.

As a UK based provider of high-resolution physical climate risk and biodiversity datasets, Map Impact welcomes SS5/25 as an important step in closing the gap between climate science and financial risk management. The new expectations align directly with our mission of supplying regulatory grade, property level climate data to help firms make informed lending, underwriting, investment, and risk decisions.

A New Regulatory Era – From Climate Awareness to Climate Competence

SS5/25 recognises three realities about climate change that the financial sector can no longer ignore:

  1. Physical risks are accelerating; including heat stress, drought, and wildfire, which now sit prominently alongside flood and storm as core UK financial risks.
  2. Risks are systemic and non-linear; they will affect every geography, every sector, and every portfolio.
  3. Future losses depend on today’s decisions; firms that lack clear understanding of climate exposure will misprice risk and misallocate capital.

Importantly, the supervisory statement makes physical risk a first-order concern. Firms must now assess how local environmental conditions amplify hazards, how risks evolve under climate scenarios, and how these factors translate into expected losses, capital needs, and business-model resilience.

This marks a shift from climate risk as a ‘sustainability topic’ to climate risk as a core determinant of financial soundness.

Granular Physical Data – No Longer Optional

While SS3/19 allowed firms to begin building conceptual frameworks, SS5/25 sets precise expectations for data, models, assumptions, proxies, and supplier governance. The PRA is clear:

Firms must identify data gaps, justify the proxies they use and demonstrate an understanding of data uncertainty, and ensure climate data are sufficiently granular to reflect the true risk profile of their portfolios.

This directly addresses the limitations of legacy hazard maps that operate at regional or postcode scales. SS5/25 emphasises:

  • Property level exposure assessment
  • Decision useful data for portfolio segmentation
  • Forward looking trajectories under climate scenarios (RCPs/SSPs)
  • Integrated understanding of hazard × exposure × vulnerability

At Map Impact, these principles underpin our four core UK national datasets:

  1. HeatView – extreme-heat exposure and future temperature stress
  2. DroughtView – soil moisture deficit, hydrological stress, and drought vulnerability
  3. WildfireView – ignition probability, spread potential, ember risk, and landcover vulnerability
  4. BiodiversityView – habitat type and condition, enabling hazard amplification and vulnerability modelling

Together, these datasets provide the granularity and scientific rigour that SS5/25 explicitly calls for, offering firms direct compliance value while improving risk insight.

Scenario Analysis – The PRA’s New Cornerstone

A significant new requirement is the strengthening of Climate Scenario Analysis (CSA). SS5/25 expects firms to:

  • Use scenarios that reflect realistic pathways of physical risk intensification.
  • Assess impacts at geographic and sector specific granularity.
  • Incorporate severe but plausible events, sensitivity tests, and, where material, reverse stress tests.
  • Link scenario outcomes directly to strategy, risk appetite, pricing, and capital adequacy.

Map Impact’s datasets are fully aligned with UKCP18 climate projections, enabling firms to:

  • Model how risk evolves over time under different temperature pathways.
  • Assess how climate risks shift PD/LGD for loan books and counterparty risk profiles.
  • Understand the long-term viability of lending and underwriting strategies.

In particular, wildfire and heat extremes are highlighted in SS5/25 as under-assessed UK risks. These are exactly the areas where Map Impact provides new analytical capability.

Counterparty, Portfolio, and Business-Model Risk

SS5/25 also requires firms to conduct structured assessments of:

  • Counterparty specific physical risk
  • Sector vulnerability
  • Geographic concentration
  • Supply chain exposure
  • Business model resilience under climate stress

These assessments are non-negotiable for material risks and must be based on evidence, not assumptions.

Map Impact enables firms to:

  • Enrich credit assessments with physical risk scores.
  • Identify vulnerable locations and high-risk concentration pockets.
  • Support Expected Credit Loss (ECL) adjustments under IFRS 9.
  • Evaluate collateral impairment and insurability challenges.
  • Inform underwriting restrictions, adaptation requirements, and risk-based pricing.

This aligns directly with the PRA’s expectation that climate risk is integrated into credit risk, market risk, operational resilience, underwriting, and the reserves for capital and liquidity.

Why SS5/25 Creates a Step Change in Industry Demand

The combination of regulatory pressure, supervisory scrutiny, and enhanced expectations will accelerate adoption of granular physical risk data across the sector.

SS5/25 creates demand for:

  • High-spatial resolution hazard data
  • Forward looking projections aligned to climate scenarios
  • Integrated landcover and condition data for susceptibility modelling
  • Transparent methodologies supported by peer-reviewed science
  • Portfolio-ready analytics at UPRN level

These are Map Impact’s core strengths.

Where global vendors may use coarse global climate models with limited transparency, Map Impact provides UK-specific, transparent, high-resolution, decision ready climate datasets, precisely the kind of data SS5/25 expects firms to rely upon.

A Regulatory Turning Point – and an Opportunity

Climate-related losses will rise in the decades ahead, but so too will opportunities for:

  • Risk differentiated lending
  • Resilient underwriting
  • Climate aligned capital allocation
  • Product innovation in adaptation finance
  • Investment in resilience infrastructure
  • Reduced losses and enhanced long-term profitability

SS5/25 encourages firms to move beyond compliance and begin using climate intelligence as a strategic differentiator.

At Map Impact, we believe the firms that invest in high quality physical risk analytics today will be best positioned to capture tomorrow’s opportunities, and avoid tomorrow’s losses.

How Map Impact Can Help

We provide the UK’s most detailed datasets for:

  • Heat hazard
  • Drought hazard
  • Wildfire hazard
  • Nature / Biodiversity score

At scales suitable for:

  • ICAAP, ILAAP and capital planning
  • ECL provisioning
  • Underwriting and exposure management
  • ORSA and SCR modelling
  • Portfolio concentration and materiality assessment
  • Climate scenario analysis
  • Strategic planning and risk appetite formation

We can work with lenders, insurers, brokers, and data partners to help them meet the expectations set out in SS5/25, quickly, transparently, and confidently.


Get in Touch

To learn more about how Map Impact can support your SS5/25 implementation planning or to request sample data, portfolio analysis, or technical documentation, please contact: info@mapimpact.co.uk

Beyond the Benchmark – Delivering PRA‑Ready Climate-Credit Risk Data for Regulated Firms

The Climate Financial Risk Forum (CFRF) is a leading industry initiative jointly established by the Financial Conduct Authority (FCA) and the Prudential Regulation Authority (PRA).

The CFRF has worked with Global Association of Risk Professionals (GARP) to publish ‘A Risk Professional’s Guide to Physical Risk Assessments: A Benchmarking Study of 13 Vendors’.


Context – What the FCA / GARP Study Reveals

The study provided the first comprehensive view of how climate‑risk data providers support physical‑risk analysis for financial firms.

Its findings were revealing:

  • Large dispersion between vendor outputs for the same assets.
  • Inconsistent geocoding accuracy, with some datasets misplacing assets by kilometres.
  • Weak transparency on model assumptions and uncertainty.
  • Limited linkage between physical hazards and financial loss metrics (ECL / ORSA / capital).
  • Uneven data governance, often falling short of PRA expectations for data lineage, validation, and oversight.

For regulated firms, the message was clear – the market for physical‑risk data is still maturing and not yet aligned with supervisory expectations on climate‑related financial risks outlined in BoE CP10/25 and PRA SS3/19 draft enhancement.

Where Map Impact Fits – Built for Regulation, Not Retrofitted

Map Impact was founded to solve exactly these gaps and shortcomings. Our Climate-Credit Risk datasets – HeatView, DroughtView, WildfireView, and BiodiversityView – were designed from inception to satisfy the data governance, scenario analysis, and auditability standards expected of PRA‑regulated firms.

Benchmark Gap (from FCA / GARP Study) Map Impact Response
Geocoding dispersion and data quality concerns Referenceable to Unique Property Reference Numbers (UPRNs), 50m resolution property data.
Narrow hazard coverage or outdated scenarios UKCP18 and SSP based projections for heat, drought, and wildfire; scalable globally; NGFS‑aligned scenarios in progress.
Missing exposure or vulnerability context BiodiversityView introduces land‑cover and habitat‑condition analytics – enabling true exposure assessment.
Lack of financial linkage Risk indices calibrated to portfolio‑loss ratios and credit metrics (PD / LGD / ECL compatibility); supports capital allocation and optimisation.
Opaque methods and weak data governance Transparent methodology, peer‑reviewed Earth Obesrvation inputs, ISO processes, and structured metadata aligned to CP10/25 Ch. 4. Conforms to ICMA code of conduct for ESG data providers.

Proven in Practice — Validated by Regulated Firms

Map Impact’s datasets have already been tested in live regulatory contexts:

  • A UK Insurer assessed 2.5 million property records for heat and wildfire exposure profiling, confirming geolocation precision and peril differentiation.
  • A UK Lender analysed an extracted 20,000‑property mortgage portfolio, confirming suitability for ECL sensitivity to heat and wildfire risk.

Both pilots confirmed that Map Impact’s outputs integrate seamlessly with existing credit and capital models – turning hazard data into actionable financial insight.

Designed for CP10/25 and SS3/19

Map Impact’s data architecture and metadata governance directly reflect the requirements outlined in PRA CP10/25:

CP10/25 Reference Map Impact Alignment
Section 4.3 Scenario Analysis Multi‑horizon hazard trajectories (2030 / 2050 / 2100) for forward‑looking portfolio stress testing.
Section 4.4 Data Governance Documented lineage, validation logs, and periodic data‑gap assessments.
Section 4.2 Business Model & Risk Appetite Portfolio‑level metrics translatable into ICAAP / ORSA frameworks.
Section 4.6 Disclosure & Auditability Traceable datasets suitable for external assurance or supervisory review.

Why This Matters

Financial regulators increasingly expect climate‑risk data to be as robust as credit or market data. Yet most vendors built their models for generic ESG or catastrophe‑risk use, not for supervisory integration. Map Impact bridges that gap; combining satellite‑derived physical risk analytics with the metadata rigour and audit trail regulators require.

For lenders and insurers, that means:

  • Faster integration into risk and capital models;
  • Clear defensibility in regulatory reviews;
  • Confidence that scenario analysis aligns with supervisory methodology.

Next Steps

Map Impact invites regulated firms to:

  1. Request a Benchmark Response Brief – showing FCA/GARP study gaps vs Map Impact’s alignment.
  2. Explore proof‑of‑concept pilots using their own portfolios under CP10/25 scenarios.
  3. Collaborate on data validation and assurance standards for the next generation of PRA‑ready climate-credit risk datasets.


Get in touch to learn more about how Map Impact can support your firm’s regulatory, risk, and reporting needs, contact info@mapimpact.io

Map Impact Responds to Bank of England CP10/25 Consultation on Climate Change Risk

Aligning Climate Data Innovation with Regulatory Expectations

At Map Impact, we’re proud to announce that we have formally submitted our response to the Bank of England’s Consultation Paper 10/25 (CP10/25), which sets out the Prudential Regulation Authority’s proposed enhancements to climate risk management expectations for banks and insurers.

Our submission focuses on how high-resolution, forward-looking physical climate risk data – specifically HeatViewDroughtViewWildfireView, and BiodiversityView – can help regulated firms meet their obligations under the evolving PRA supervisory framework, including ICAAP, ORSA, and IFRS 9.

Supporting the PRA’s Objectives

In our response, we welcomed the PRA’s recognition that physical risks are systemic, correlated, and non-linear. The consultation rightly identified significant data and capability gaps, particularly around location-specific physical risk assessment, scenario analysis, and the integration of nature-based indicators.

Map Impact’s data products directly support several of the areas highlighted in the consultation:

✅ Asset-level risk analysis across time horizons and emissions scenarios
✅ Scenario-based modelling of heat, drought, and wildfire impacts
✅ Data-ready, spatially detailed metrics for integration with risk models
✅ Biodiversity-linked resilience indicators to support nature-financial risk correlations
✅ Scalable, modular tools suitable for firms of all sizes

Recommendations to the PRA

Map Impact made four key recommendations in our submission:

  1. Encourage integration of localised physical risk data from specialist providers to improve risk granularity and regulatory scenario alignment.
  2.  Support the use of biodiversity and nature-based indicators as part of asset-level climate vulnerability analysis.
  3. Define minimum standards for third-party data usage, ensuring transparency and methodological rigour.
  4. Promote modular and scalable solutions that enable proportionate compliance for smaller banks and insurers.

We also highlighted the relevance of our data to infrastructure asset risk, referencing the UNEP 2025 “Bridging Credit and Climate Risk” report, which emphasises the vulnerability of critical infrastructure to both chronic and acute climate risks.

Looking Ahead

We believe that firms subject to the enhanced expectations outlined in CP10/25 and the revised Supervisory Statement 3/19 will need to move quickly to:

  • Undertake a climate data and capability gap analysis
  • Establish physical risk assessment frameworks using forward-looking, localised data
  • Embed nature and climate risks into capital planning, provisioning, and disclosure

Map Impact stands ready to support this transition, offering UK-specific, property-level data that goes far beyond traditional flood modelling or coarse-resolution climate assessments.

Click here to download our full CP10/25 consultation response (PDF)
Learn more about our data products → https://www.mapimpact.io

Join the Conversation

If you represent a bank, insurer, or advisory firm exploring how to meet these new regulatory expectations – or if you’re undertaking a formal CP10/25 readiness review – we’d be pleased to start a conversation.

Contact: Steve Keohane – sk@mapimpact.io

The Wennington Wildfire 3 years on

Image.jpg
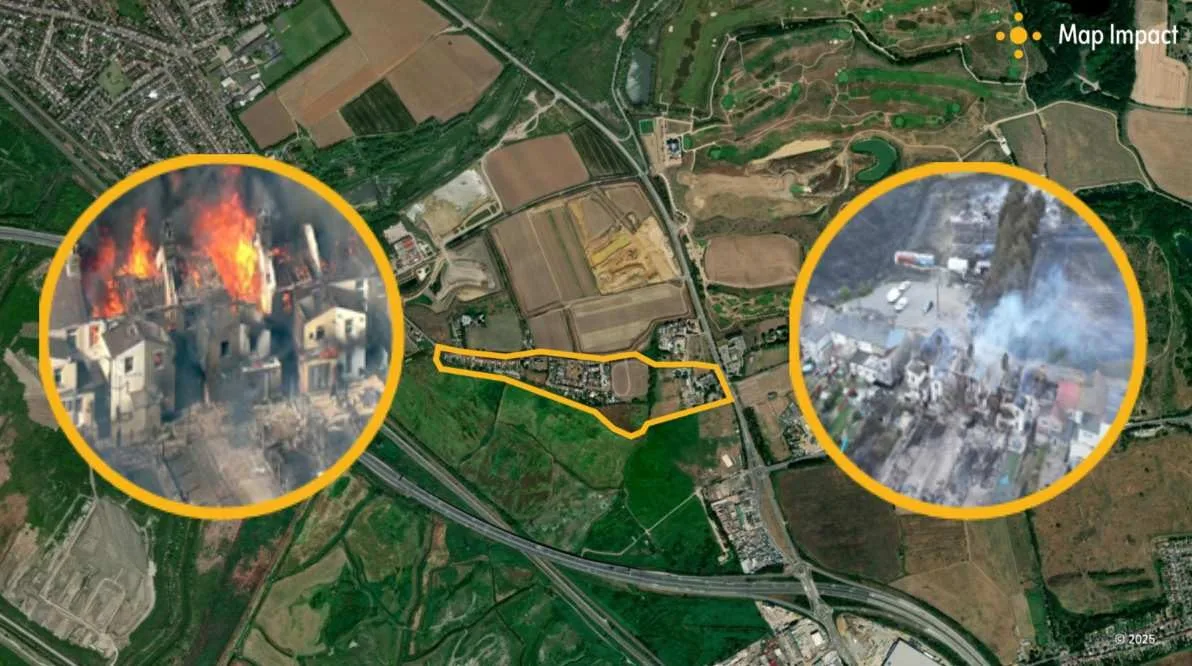
Figure 1 In July 2022 the UK experienced a severe heat wave with conditions that were exceptionally hot and dry. A wildfire in Wennington, London, spread across 40 hectares and destroyed 17 houses.

Historically, when wildfires have occurred in the UK, they have tended to be limited to moorland or upland areas. Urban areas neighbouring specific habitats, such as gorse and heath, are a cause for concern, such as common land areas. Some examples of this in the South East can be found around Yateley, Sandhurst, and Moors Valley Country Park near Ringwood.

The acceleration of climate change is substantially increasing the risk to our urban areas. The risk is greater in areas of poor habitat condition, creating fuel for fire to catch. This happens when wetter winters promote vegetation growth, and drier springs and summers dry out vegetation, resulting in a higher fuel load, as seen in the spring of 2025. Dry weather leads to increased human activity outdoors where the use of BBQs, and fire camps create additional risks. Windier weather pushes the oxygen needed to cause wildfires to spread rapidly, as witnessed in Scotland¹.

Several wildfires occurred back in July 2022 around London (the London Fire Brigade claimed it as their busiest period since World War 2). This was caused by drought, high temperatures, dry vegetation, and high fuel load. Wennington is situated at the rural-urban interface, as it is not densely urbanized (with sealed surfaces such as tarmac and concrete), which makes it more susceptible to the spread of wildfire. In fact, analysis by Burton. C et al2 also reveals a 6-fold increase in the probability of very high fire weather in the UK due to human influence, driven by poor land conditions.

Chart.jpg
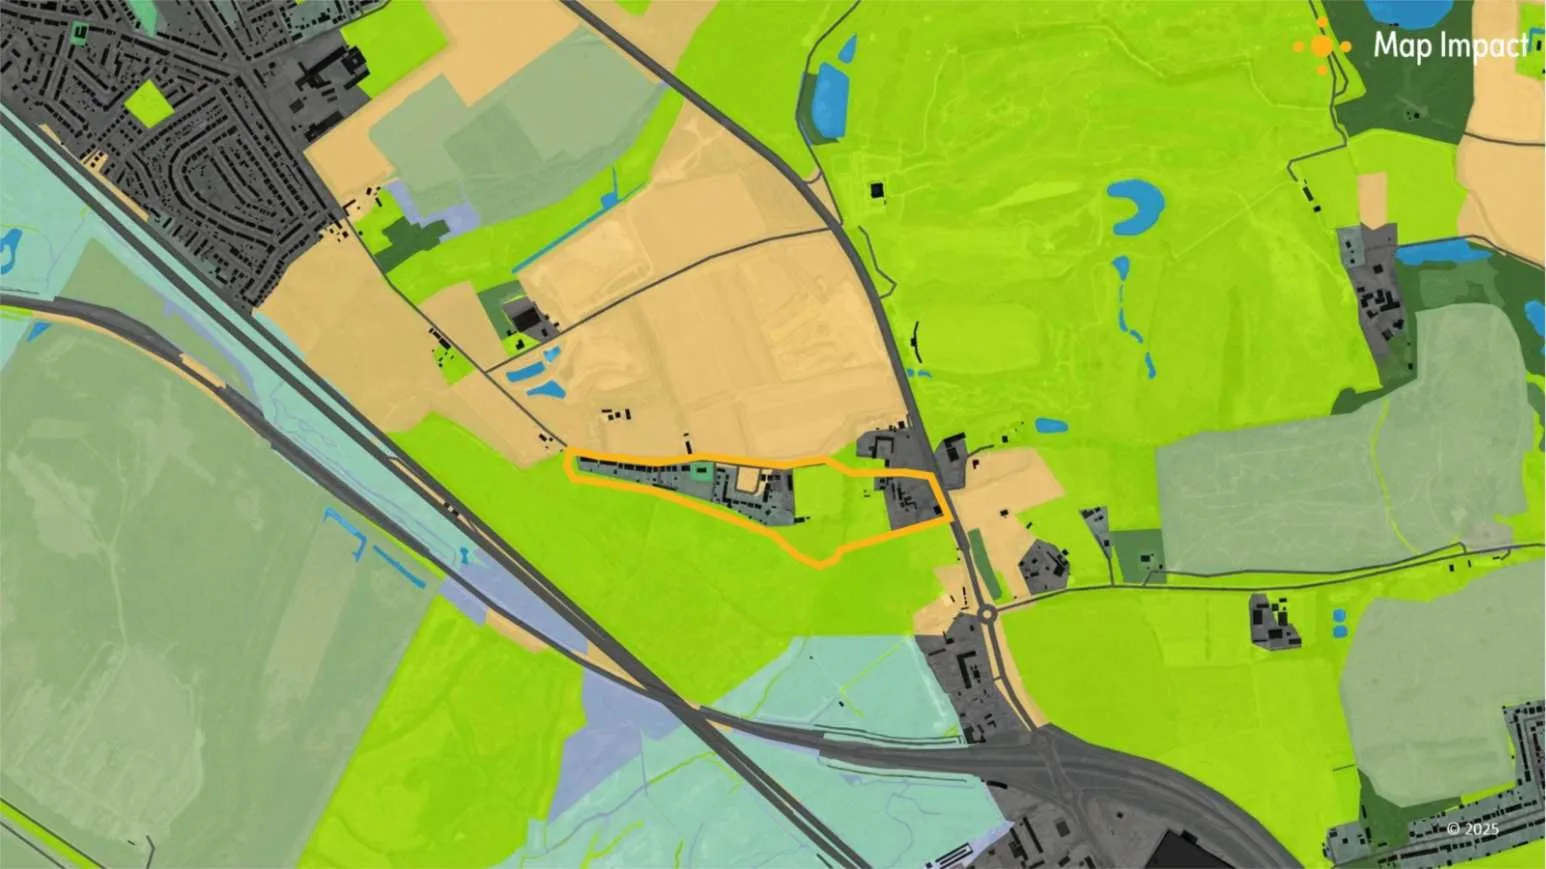
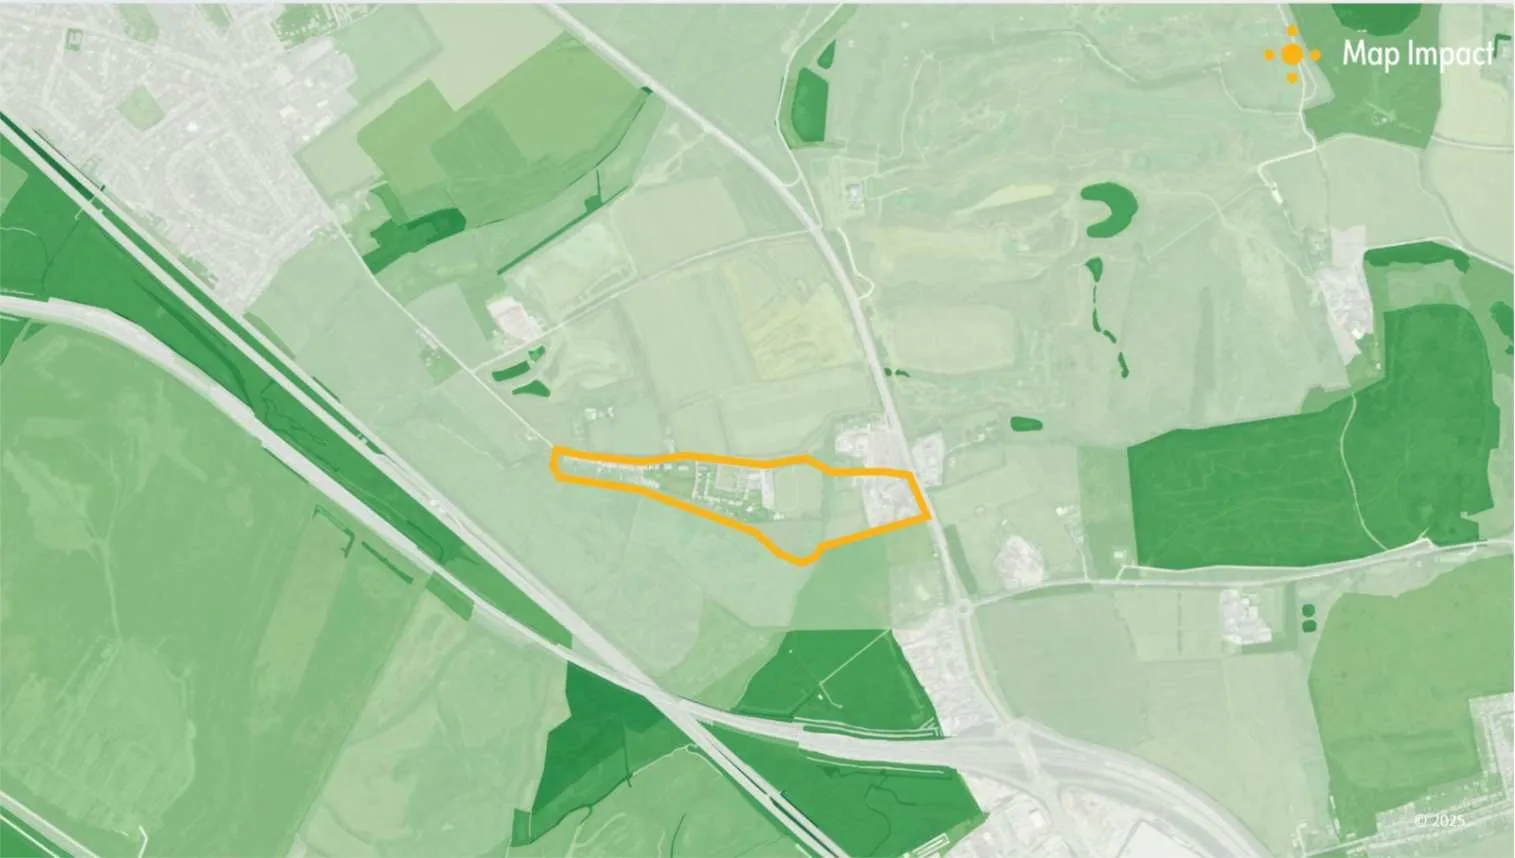
Figure 2 Habitats within the region include grassland, cropland, marshland and peri-urban landscapes

Map Impact understands this risk. We uniquely utilise our understanding of habitat and biodiversity in BiodiversityView to assess the condition of the land and its potential to produce fuel, as well as its susceptibility to ignition by human influence, among many other key datasets that help inform the risk, such as soil moisture content, land surface temperature, and a model of historic wildfires.

Chart 2.jpg
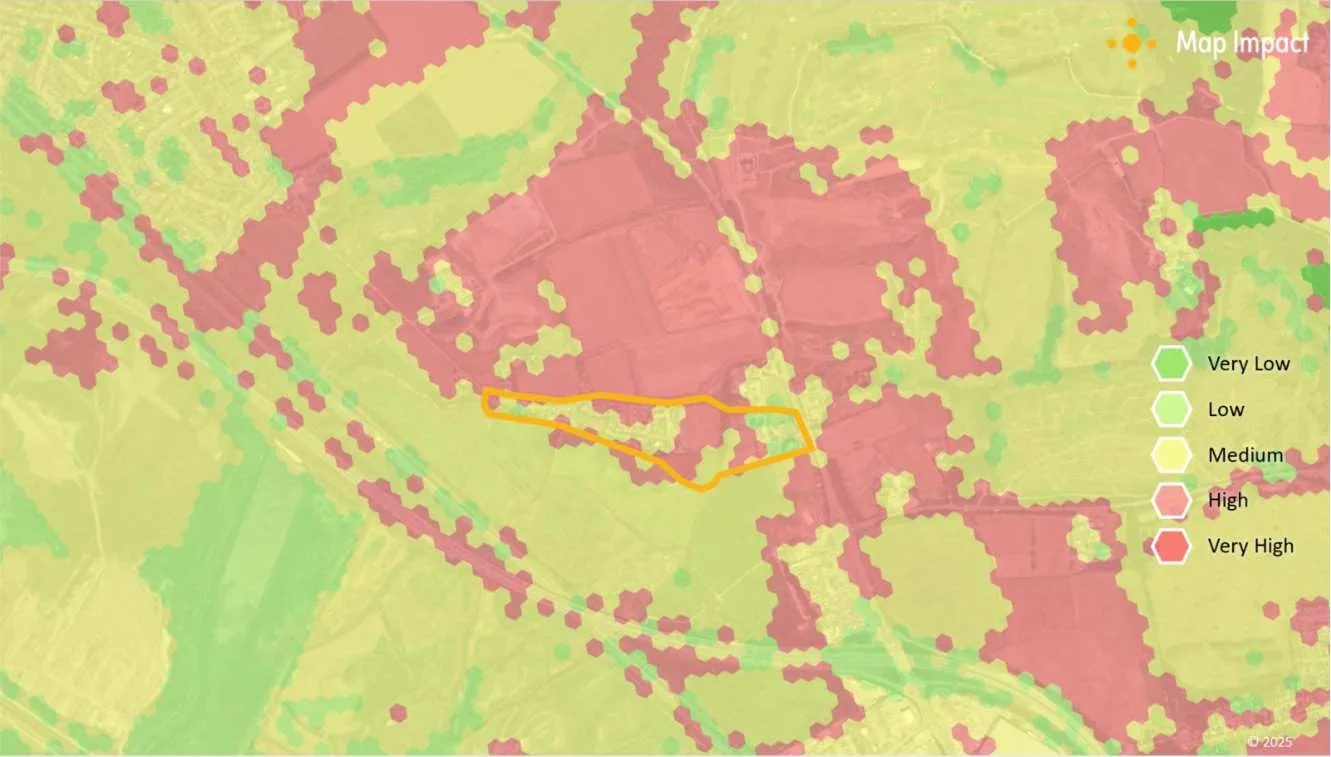
Figure 3 Map Impact’s BiodiversityView shows the habitats to be in generally poor condition

These underlying data provide key insights into our WildfireView product, which is designed to help our customers understand the hazards and potential risks associated with wildfires. The availability of robust and current data allows individuals and organisations to make informed and strategic decisions to reduce financial and personal risks. The type of land cover (figure 2) and its condition (figure 3), as mapped by Map Impact, indicate multiple origination points of wildfire and show where it may spread. Being aware of this nearby risk will allow property owners and authorities to take preparatory steps to reduce the potential impact. Our data also includes forward looking climate predictions from the UK Met Office, based on how the risk changes if the climate continues to warm over the next 30 to 50 years.

The increased risk associated with climate change is one of the reasons solicitors are being advised to consider wildfire as part of the conveyancing process, as a wildfire outbreak can now lead to catastrophic loss. The Law Society Practice Note now recommends that the legal profession consider wildfire risk as best practice to help inform potential property buyers. As a result, and to support solicitors in advising their clients on the risk, our data is now used in conveyancing reports such as those provided by Martello³.

Chart 3.jpg
Figure 4 Map Impact’s WildfireView directly links underlying landscape condition to wildfire susceptibility.

This month, as we approach the third anniversary of the Wennington wildfire, we are once again faced with similar extreme hot and dry conditions. The UK still has work to do on its strategy for tackling these incidents. Developing a deeper understanding of the areas most susceptible to these flashpoints is the first step. And in all of this, we must remember there is a human element. The residents of Wennington, many of whom lost their homes, are still facing significant challenges. The situation was further complicated by the fact that some houses had no insurance, especially if they had no insurance and were in the middle of the terrace. This meant that houses either side of the uninsured property had substantial delays in rebuilding as the middle house couldn’t cover the cost for their rebuild⁴,

Reconstruction has also been slow. While demolition of destroyed homes began in 2023, many residents were told they wouldn’t be able to return for at least a year. Others have been caught in insurance disputes or facing unexpected rebuilding costs, including planning fees and levies typically applied to new developments⁵.

Chart 4.jpg
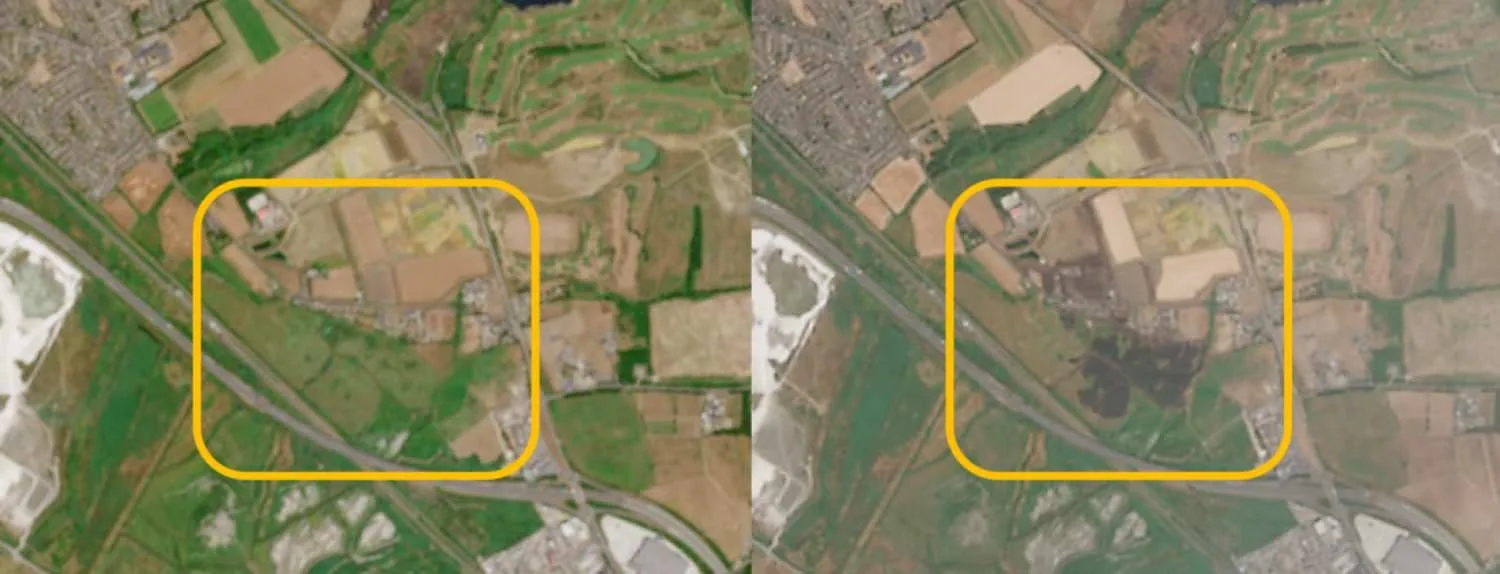
Figure 5 Left Sentinel 2 Satellite image showing Wennington 4 days before wildfire event (15th July 2022), Right Satellite image showing after wildfire with burn scar (9th August 2022)

Some elderly residents were unsure whether they would live long enough to meet the conditions for tax exemptions tied to rebuilding.

However, from the ashes, there are some positives: the community raised over £30,000 to support those in need, and the local council made a concerted effort to find alternative accommodation and provide mental health and trauma support. The residents are finally in their new homes.

In response to the Wennington incident, Havering Council has been working with the London Fire Brigade to implement fire prevention strategies, including creating fire breaks, clearing overgrowth, and discouraging the use of disposable barbecues.

Deputy Commissioner Charlie Pugsley of the London Fire Brigade said in a 2025 statement “Extended periods of hot and dry weather can greatly increase the risk of a grass fire and particularly when that grass is tinder dry, the spread of fire can be rapid. We have seen examples of this in London as well as more recently worldwide, such as in California and South Korea……it is vital we all do what we can to protect those areas ahead of periods of hot and dry weather.”

Since the Wennington incident, the London Fire Brigade has focused on training and investment in wildfires, including specialised fire trucks6. The London Fire Brigade cannot visit every single landowner in London to assess the risk; fortunately, Map Impact can help identify areas of the highest risk of ignition.

At Map Impact, we detect the susceptibility of wildfires, and as demonstrated in the figure above, our data aligns with the susceptibility of the Wennington location to wildfire.

Using data insights derived from WildfireView, we can help emergency services and households understand and mitigate the risk of wildfire taking hold. Our current data indicates that the risk is still present, but it can now be understood and addressed to prevent it from having the same impact if it were to happen again. It’s essential to consider how wildfires impact the entire property lifecycle. The insurance industry would like planners to carefully consider the location of homes when building near areas susceptible to fire, and to ensure that any such areas have fire management plans in place, similar to the consideration given for areas susceptible to flooding. Conveyancers also should inform people about wildfire risk before they purchase a property, so potential property owners are forearmed and forewarned. Knowing the risks and how to respond means people can adapt and reduce the risk of wildfire affecting their property and possessions. Map Impact Wildfire data insights enable the assessment of risk and adaptation accordingly. Insight into conditions now and our potential future is key to adapting to our changing climate. When conditions change and the media lose interest, we must not forget that the risk remains. “A wildfire in itself is a long-tail event… very low likelihood, but very high consequence… and then when the cameras disappear, we don’t really hear much about it.”, Oliver Baldock Director, Ashfield Environmental Risk Consultancy. Ashfield has been involved in Wennington since 2023 as part of the housing rebuild programme.

Post written by Map Impact, July 2025


References

¹ Warning of ‘very high’ wildfire risk across Scotland – BBC News 
² Chantelle Burton et al 2025 Environ. Res. Lett.20 044003DOI 10.1088/1748-9326/adb764 
³ Martello
⁴ Revealed: Several fire-destroyed Wennington homes were uninsured | The Standard
⁵ Homeowners charged extra £10,000 by council to rebuild houses gutted by wildfire
⁶ https://wwwnsuondon.gov.uk/who-we-are/what-london-assembly-does/questions-mayor/find-an-answer/risk-wildfires

Meeting Climate Risk Expectations: How Map Impact Data Supports Compliance with CP10/25 and SS3/19

Introduction

On 30 April 2025, the Bank of England published Consultation Paper CP10/25 and a draft enhanced Supervisory Statement (SS3/19), significantly raising regulatory expectations for how financial firms should manage, measure, and mitigate climate-related risks. These documents signal a decisive shift: climate risk is now firmly embedded as a material financial risk requiring serious governance, rigorous data, and structured integration into firm-wide risk management and capital adequacy frameworks.

As regulated lenders and insurers navigate this complex transformation, Map Impact provides property-specific intelligence at national scale which complies with these evolving standards. Flagship solutions – HeatViewDroughtViewWildfireView, and BiodiversityView – are designed to help firms close data gaps, conduct robust scenario analysis, and refine Pillar 2 capital adequacy planning. This article explores how.

The Regulatory Context

For both IRB-accredited firms and those using the Standardised Approach (such as many building societies and domestic insurers), the PRA has made clear that climate risk must be assessed through a forward-looking, proportionate lens. Importantly, this includes applying granular climate data to enhance internal risk insight and inform capital planning.

Where Map Impact Adds Value

Map Impact specialises in high-resolution physical climate and landcover datasets that align with the types of use cases now demanded by the PRA. These datasets are rooted in UKCP18-aligned scenarios and risk pathways. They include:

  • HeatView: Assesses urban and rural heat stress risk based on land surface temperature trends, urban morphology, and future temperature pathways.
  • DroughtView: Maps locational drought risk using vegetation health indices, soil moisture trends, and exposure of water-dependent land uses.
  • WildfireView: Identifies wildfire-prone areas through a fusion of dryness indices, vegetation type, topography, and historic burn data.
  • BiodiversityView: A unique baseline of habitat type and condition, offering insights into land resilience and natural capital that moderates physical climate risk

These solutions detail a property’s current and future exposure through to the end of the century.

Applications Across the Regulatory Framework

  • Risk Identification and Materiality Assessments
    Map Impact’s UPRN and property-specific climate risk intelligence enables institutions to identify concentrations of physical risk across mortgage and insurance portfolios. For example, a building society can map wildfire or heat stress exposure across its residential lending book to determine individual property exposure.
  • Scenario Analysis and Stress Testing
    PRA expectations now call for granular and tailored scenario testing. Map Impact datasets can be applied to forward-looking climate pathways (e.g. RCP 4.5 or 8.5 through to 50 years hence) to estimate future risk exposure by location and asset class. Firms can use this to construct reverse stress tests, identify systemic vulnerabilities, and build capital resilience scenarios.
  • Pillar 2 (ICAAP/ORSA) Capital Planning
    Firms must assess whether additional capital is needed under Pillar 2. By matching Map Impact’s property-specific risk data with secured lending or underwriting portfolios, firms can better understand and evidence where capital buffers may be prudent, and optimise their capital requirements.
  • Governance and Board-Level Reporting
    Map Impact’s outputs are designed to support board reporting obligations under the enhanced SS3/19. They deliver clear, decision-relevant outputs to help Senior Management Functions (SMFs) understand and oversee climate risk drivers.
  • Closing Data Gaps and Enhancing Quality
    One of the PRA’s recurring themes is the need to address climate data gaps and biases. Map Impact closes this gap with consistent, national scale property-specific datasets that are evidence-based, auditable, and continuously updated using satellite-derived intelligence.

Special Relevance for Standardised Firms

Small to mid-sized firms using the Standardised Approach to their calculations of capital adequacy often lack the dedicated resource to develop proprietary models, and in the case of addressing the impending Supervisory Statement, ingest property-specific climate risk data. This will result in a sub-optimal outcome for the calculation of capital requirements. Map Impact’s solution is tailored for these institutions: we integrate the property-specific data and assessment framework that enables the firm to meet regulatory expectations and negate the requirement for an additional capital adjustment from a portfolio-level approach.

This is particularly useful for:

  • Building societies and credit unions
  • Challenger banks with mortgage portfolios
  • Regional insurers underwriting property risks

Looking Ahead: From Regulatory Readiness to Strategic Advantage

Firms that embrace climate risk integration early and comprehensively will not only satisfy regulatory obligations, but also gain strategic benefits: better risk-adjusted pricing, enhanced resilience, and improved stakeholder confidence.

Map Impact is ready to partner with financial institutions at all stages of this journey. Whether supporting climate stress testing, helping refine ICAAP, or building custom exposure dashboards for executive oversight, the goal is to make climate risk actionable and aligned with the PRA’s stringent expectations.

Conclusion

CP10/25 and the upgraded SS3/19 have raised the bar. The challenge, and the opportunity, now falls on firms to show that they understand their climate risk exposures and have credible, data-driven plans to manage them. With Map Impact’s property-specific datasets, financial institutions can not only meet these enhanced expectations but lead the way in building a more resilient financial system.

To learn more about how Map Impact can support a firm’s regulatory, risk, and reporting needs, contact info@mapimpact.io